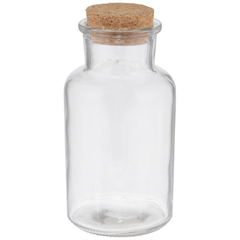
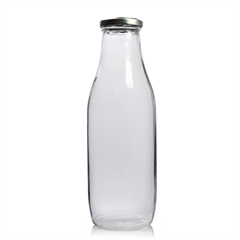
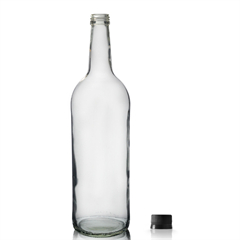
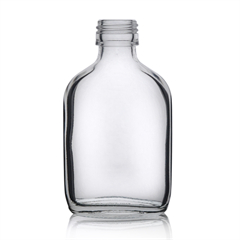
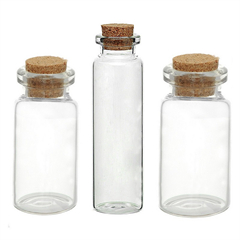
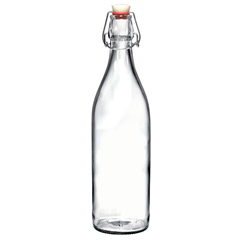
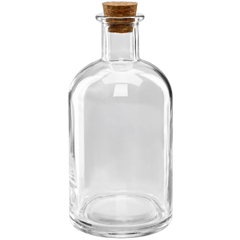
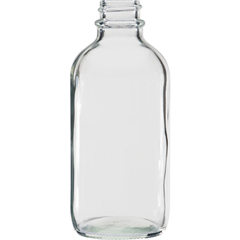
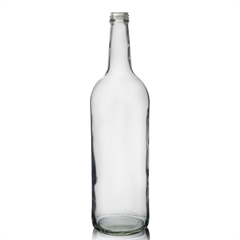
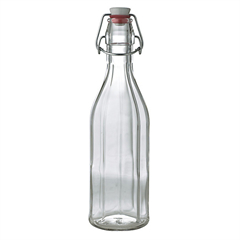
A glass bottle is a bottle made of glass. The size of glass bottles can vary widely, but the most common size range is between 200 ml and 1.5 liters. Common uses for glass bottles include food seasonings, sodas, wine, cosmetics, pickling agents and preservatives. These types of bottles are practical and can be used in commercial industries. It includes the 2 parts analysis:
The relationship between bottle capacity and bottle weight
The relationship between bottle capacity and PET waste
The relationship between bottle capacity and bottle weight
Comparing models with different functional specifications for bottle capacity revealed that a quadratic model fits better than a linear model (F test, df = 1, F = 18.36, p < 0.01) but a cubic model does not fit better than the quadratic model (F test, df = 1, F = 2.14, p = 0.14). Bottle weight is thus a quadratic and convex function of bottle capacity and the efficiency of the bottle (its capacity to weight ratio) is a concave function of bottle capacity, as depicted in Fig. 1. The relationships exhibit the same shape across categories and the concavity is robust, as depicted in Fig.(For carbonated drinks there are no bottles larger than 67.7 oz but the weight-efficiency curve is still concave). Thus, small bottles are the least efficient and large bottles actually may be less efficient than midsize bottles. In particular, the maximum efficiency is achieved at 76.60 oz.
The relationship between bottle capacity and PET waste
We next use field data to assess the implications for plastic waste generation of the above relationship between bottle capacity and bottle weight. First, we obtained the PET tonnage collected for recycling in each Minnesota county for 2009 to 2013. Second, we procured county-level data on sales of beverage bottled in PET from The Nielsen Company (US), LLC (a company that collects and maintains retailing data from the grocery, convenience, drugstore, and mass merchandising channels). Lastly, we gathered data from the U.S. Census Bureau for use as controls. We matched these three data sets by county and by year. This enables us to relate the capacities of the bottles actually sold to PET collection tonnage in the same year (beverages are typically consumed and their bottles disposed in just days or weeks after purchase).
